Know exactly what works. Then double down on it.
Limio measures the whole journey, from the ad click to the paid order and on to the renewal, and shows you which step loses people, which channel pays back and which offer sells. There is no tagging project, no data team to hire and no waiting.




Where the money hides
Conversion and retention move when somebody can see them. What Limio customers have achieved.
- +13.9%
- Checkout conversion After rebuilding the checkout on Limio
- +7.3%
- Average order value With upsells and add-ons surfaced in the cart
- 32.5%
- Of online cancellations saved Once reasons were measured and routed to the right offer

Answer any question about your subscriptions.
Funnel, channels, offers, payments and retention, each with its own report below.
Where do we lose people?
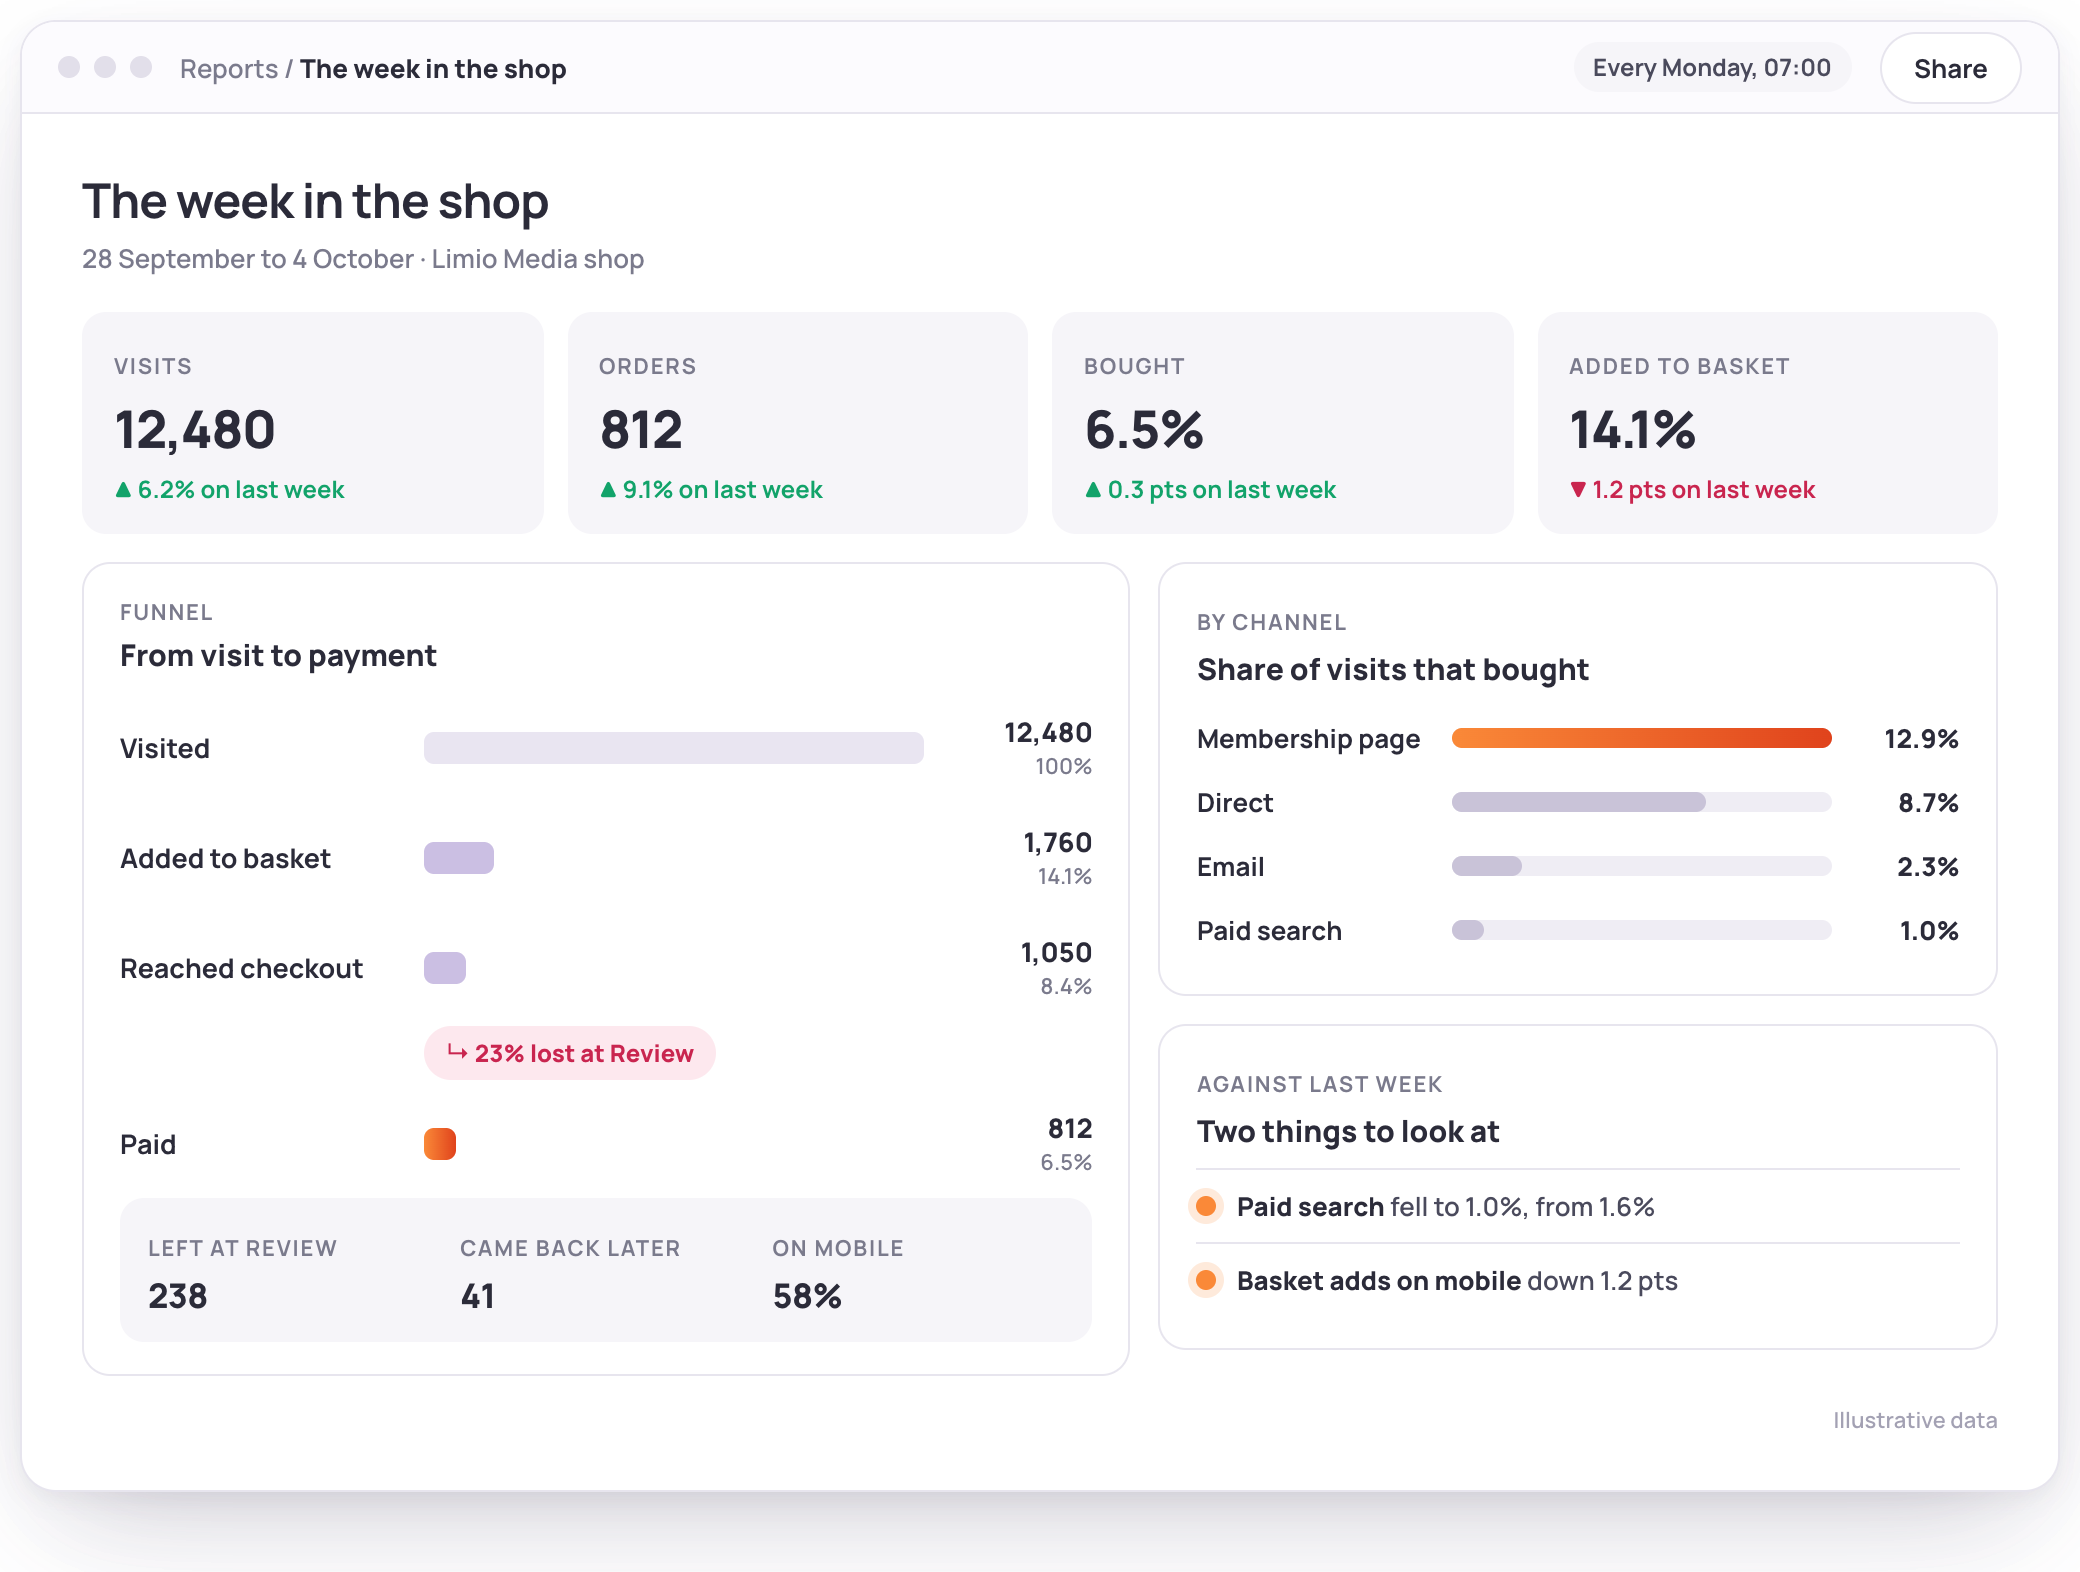
See how many people reach each step, from the first page to the paid order, and where they stop.
The funnel, step by step
6.5%of visits boughtVisited the shop, added to basket, reached the checkout and paid, with each step counting only the people who made the step before it, so every loss is a real one.
- weekly · by checkout · by variant
End-to-end conversion
812orders this weekOne number for the period, set against the one before, with the step rates beside it so you know which one moved.
- weekly · monthly · quarterly
Day by day
Orders and visits per day, so a bad Tuesday does not hide inside a fine week.
- daily
By device and step
Where phones drop out and desktops do not, step by step, so the mobile form gets fixed first.
- by device
Checkout errors
Baskets that only ever saw an error, how many orders that cost, and what the error was.
- weekly · by checkout
Conversion per checkout
Each checkout judged on its own numbers, so a renewal checkout, a new-purchase checkout and a test variant each get their own conversion rate.
- by checkout page
Which channel and campaign pays back?
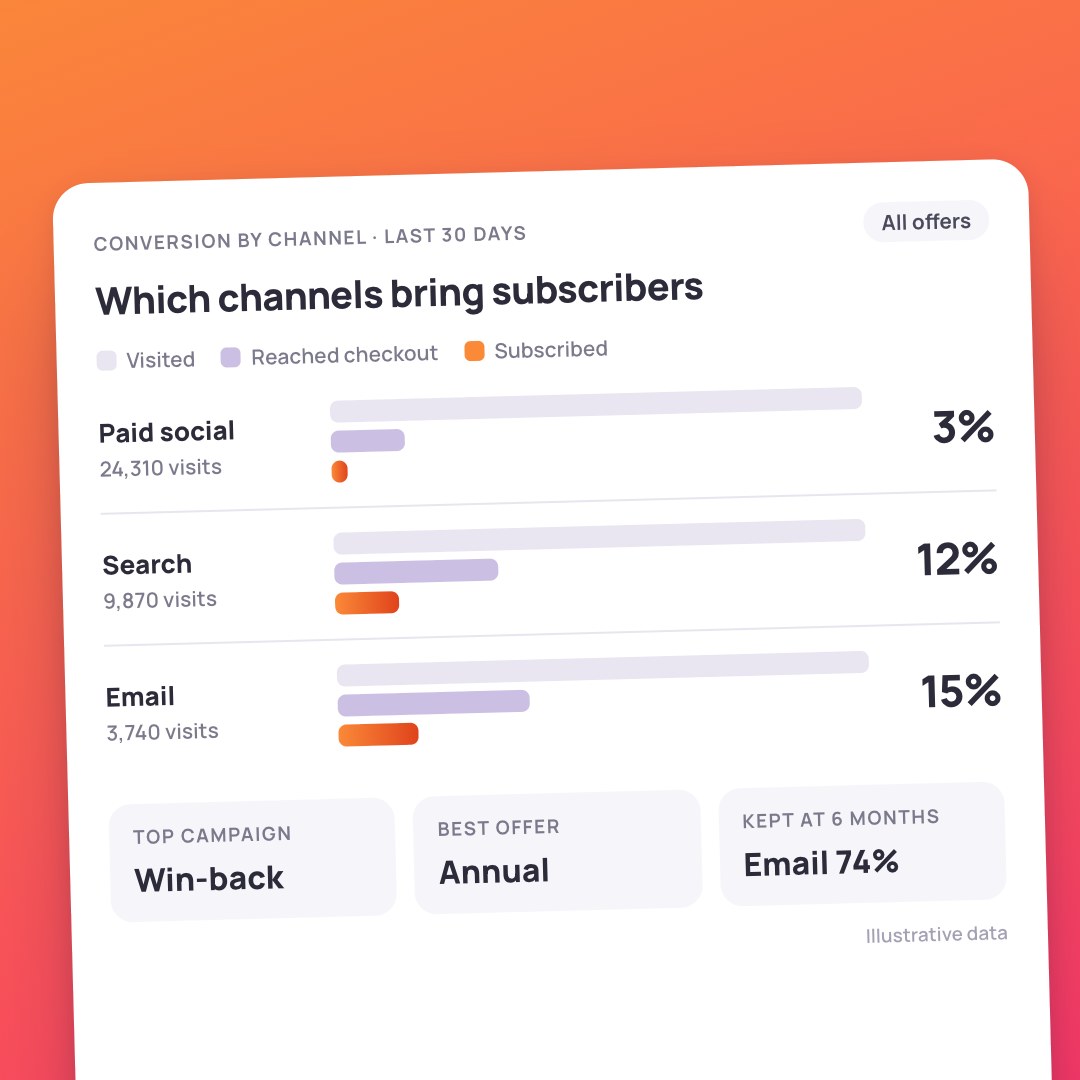
Every order carries its tags and its referrer, so spend is judged on orders, not clicks.
Conversion by channel
11.4%best channelPaid search, social, email, partners, direct and your own pages, each with visits, orders and the rate.
- by source · by medium · weekly
Best and worst links
The five campaign links that convert best and the five that waste visits, with a volume floor so a tiny test cannot mislead.
- by campaign · by content
Owned media, ranked on orders
Emails, splash pages and in-product messages ranked on the orders they produced rather than the clicks they got.
- by link · weekly
Return on ad spend
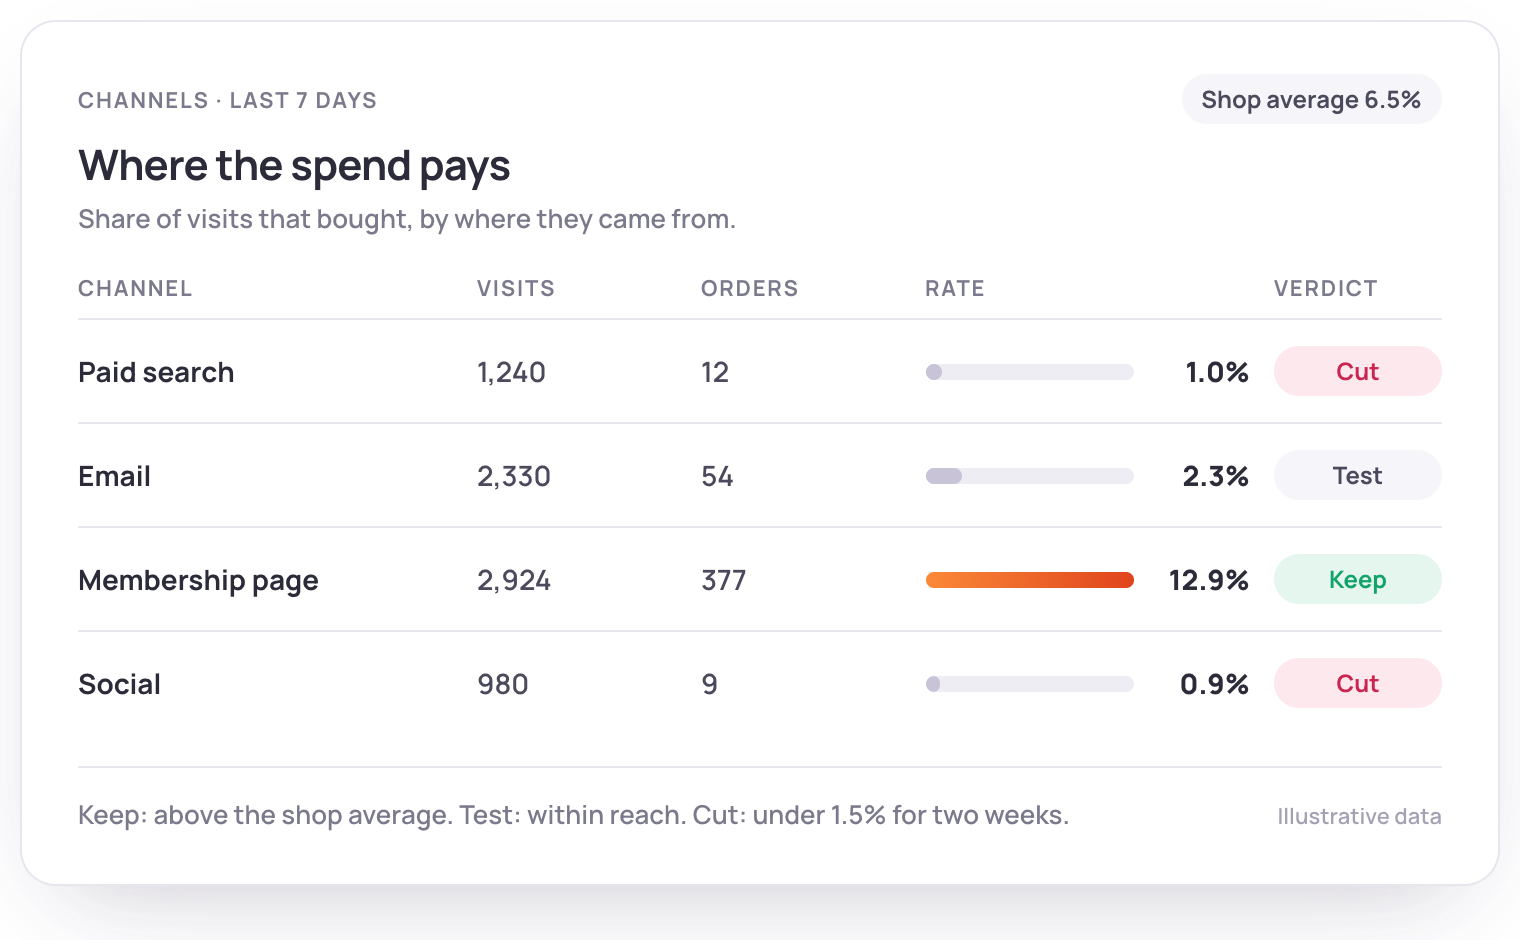
Orders per paid channel beside the spend you give us, with a verdict per campaign: keep, test or cut.
- by channel · by campaign
Promotions over time
Which headline offer ran when, and what happened to orders and order value when it changed.
- monthly · quarterly
Which channels keep customers
The acquisition channel stays on the subscription, so you see which channels bring customers who renew and which bring ones who churn. Spend judged on retention as well as on first orders.
- by channel · by cohort
What did they buy, and how did they pay?
The order records, cut by offer, by discount and by payment method, with the money that never arrived.
What they bought
Tier, product and term for every new order, with the share sold as a trial and the share that went to someone who had a trial before.
- by offer · by product · by term
Value per order
+12%revenue per orderOrders a month, revenue per order and revenue a month, so a smaller discount that sells fewer but bigger orders shows as exactly that.
- monthly · quarterly
Add-ons and cross-sells
The share of orders that took an add-on, by add-on, and the revenue it added to the basket.
- by add-on · quarterly
Payment mix
How orders paid: card, Direct Debit, Apple Pay, PayPal and the rest, and how that mix shifts when you add an incentive.
- weekly · by method
Lost to a refused payment
£1,240lost this weekOrders that never completed because a card was refused, with their value, and the Direct Debits that bounced a week later.
- weekly
New and returning buyers
The share of orders from people who bought before, and how much faster they get through the checkout.
- quarterly
Why do they leave, and who stays?
The ones who bought, followed through to the renewal, the cancellation and the save.
Cancel reasons
Why people say they leave, as a share of every cancellation, with the save rate for each reason.
- by reason · by channel
Saves and save offers
33%saved onlineHow many cancellation conversations end in a save, online and by agent, and which offer they took.
- by channel · by offer
Survival by cohort
How many of each month's joiners are still paying at month three, six and twelve.
- by start month
Trial outcomes
How long trials last, whether a charge landed before the cancellation, and who comes back for a second trial.
- by brand · by offer
Renewals and switches
Upgrades, downgrades and renewals month by month, and the revenue they moved.
- monthly
Failed renewals
£3,180lapsed this monthRenewal payments that failed, what they were worth and how many came back, by payment method, so you can see what a Direct Debit incentive is worth.
- by payment method · monthly
 Real time
Real-time numbers, however your team works
You do not have to wait for a report. The Limio app shows checkout conversion, orders, cancels and saves as they happen, and your AI assistant can ask Limio the same questions from the same live data. The rest of your tools get the numbers through the API and your analytics tags.

Live in the Limio app
Checkout conversion, new and renewal orders, cancels and saves, and switches, as they happen, and exportable.
Live for your AI assistant
Connect Claude or another assistant to Limio and ask how many orders a campaign brought today, or compare two checkouts, with the answer drawn from the live data.
Open to your other tools
Orders, subscriptions, customers and events as they happen, through the API, for your warehouse or your reporting tool.
Google Analytics and Google Tag Manager
Every checkout event flows into Google Analytics or your tag manager, with the campaign tags carried on the order.
What moved, in every report
Each report compares with the period before. Tell us what counts as a move, and it is flagged in plain sentences when it happens.
 Return on ad spend
Judge every pound by the orders it brought
Paid search, paid social, display, affiliates and newsletters, each with visits, orders and conversion, so you can see which campaign brings buyers and which brings browsers. Add your spend and the return is the next column.
Keep, test, cut
A verdict per channel and per campaign, grounded in orders rather than clicks.
Partners and affiliates on the same footing
Newsletters, affiliate networks and partner links ranked on what they sold.
Attribution that survives
Tags are captured on the first visit and carried on the basket, the order and the subscription, so the renewal is attributed too.
“Being able to see conversion rate by channels and understand drop-off points was a huge selling point of us moving to a membership platform. We never had this level of detail on the conversion funnel.”
Membership lead at a Premier League club
Measured on the shop itself, so the figures hold
Nothing to install, nothing for an ad blocker to hide, and every figure tied to an order.

No tagging project
Limio records its own traffic and orders, so there is nothing to install before the first report.

Counted in orders
Every figure is tied to the order records, which is what your finance team counts.

Yours to keep
Every figure can be exported, and the API gives your warehouse the raw orders, subscriptions and events.
Analytics questions, answered
The questions marketing and commercial leads ask us first.
See your own funnel before you buy anything.
Book a demo and we will walk through a real funnel, then talk about yours.
